
Fed up with the limitations of UbiDots and want to roll your own then take a look at this configuration.
The iSpindel is capable of sending its data to a number of different systems. Ubidots can be configured using the basic iSpindel guide. It’s good, it’s free but if you’ll eventually hit the limits of their generosity. They allow for 50,000 data points per day, which sounds like a lot but that includes views too. It seems ok for one iSpindel but I found that I was hitting the limit very quickly once I had two iSpindels and was doing the initial calibrations.
So I started to look for alternatives. It took a little while to figure out what exactly was needed but quickly settled on a couple of free products. Initially I was going to write something myself using the ‘http’ output from the iSpindel but that would have been re-inventing the wheel.
If you take a look at the service types in the iSpindel’s configuration you’ll see that there are a number of options:
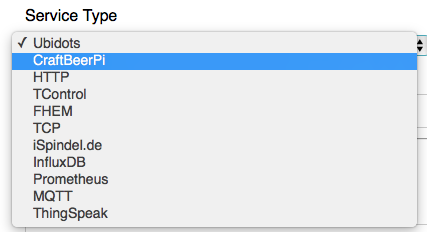
- As stated, Ubidots is the default and HTTP is an option if you want to write your own.
- CraftBeerPi seems to be able to display the most recent values but I wasn’t sure if it kept a history.
- A number of the options seem to be based around decision making, If X Then Y sort of things, aimed at triggering parts of the brewing process.
- TControl seems to be home brew control software.
- FHEM is a home automation system
- TCP is something iSpindel specific but my German isn’t good enough to understand what.
- Ditto iSpindel.de.
- We’ll come to InfluxDB shortly (spoiler alert: it’s the one I chose).
- Prometheus is an alternative to InfluxDB
- MQTT is a generic IFTTT type decision engine.
- ThingSpeak sounds like a Ubidots type approach for IoT systems but it interfaces with MatLab, of which I have no experience but am aware that’s a pretty steep learning curve. Too powerful for my basic needs.
Thus we come to InfluxDB (and Prometheus). If you’re familiar with relational databases (MySQL, MSSQL et al.) then you’ll know that you design a schema, create tables, enter data etc etc. The schema can be pretty much anything: books, accounting, films… anything. One specific use is logs. In my line of work I’ve used databases to store data sent from devices in tables with a timestamp. Each, say, log entry gets a timestamp so that it can be searched on and ordered. Well, it turns out that there are special database engines which just handle this sort of of ‘Time Series’ data. They’re called Time Series Databases. InfluxDB and Prometheus are two of these. I’ve used Prometheus before as part of GitLab and it appears to have memory leaks and generates lots of files. It was annoying so I ditched GitLab. For this project I decided to use InFlux instead.
The biggest difference between InFlux and databases like MySQL is that you don’t design a schema and create tables – you just send data to it. Ok, so you still have to create a database but after that, just send data and the engine takes care of the storage. It’s worth noting that the data types have to stay consistent. i.e. if you send an attribute of ‘temperature’ and the value is a float then sending a string later is going to mess things up. This shouldn’t really be a problem for us though.
Additionally InFlux has a simple HTTP-based API for getting data into the system. Just send a GET or POST with a JSON body containing the key/value pairs.
Hopefully you can see why this approach fits well with IoT devices like iSpindels. They send the same data, in small quantities and don’t have much in the way of configuration or ability to incorporate special client libraries.
So, now we have a way of storing the data from the iSpindel. How about displaying the data? Grafana seems to be the current ‘go to’ software for this and it has a InFlux library built in in the most recent versions. Every indication is that it’s as capable as UbiDots at displaying data. Things should be simple and, for the most part, they are.
Requirements and Prerequisites
You’ll need a linux server. I’ve used an Intel NUC but a RPi should be enough for this. It has to be on all the time because your iSpindel will be sending data to it all the time (that it’s on). The device will need a small amount of storage and a small amount of memory. Neither InFlux nor Grafana are resource hogs.
The only real decision I had to make was whether to put the software behind a reverse proxy or just talk to them directly on their own ports. Either way should work. If you’re happy with reverse proxies then it might make things a bit more secure and a bit more portable but if you’re not then don’t worry, just talk to the devices directly.
That said, I tend to default to at least creating a service related CNAME for portability, which is what I’ve done here. My server, winterfell, has CNAMEs of influx and grafana for portability. However, if you don’t have a DNS server at home (why not???) then the IPs should work equally well.
iSpindel configuration
- Put it in config mode
- (Optionally: set the interval to, say, 60s to make debugging easier)
- Select ‘InfluxDB’ from the service type menu
- Enter the hostname of the server ‘influx’.
- Enter the port ‘8086’. This is the default.
- Set the database to be ‘ispindel’.
- Ignore the auth stuff.
- Save the config.
Now, if you run tcpdump on your server you should see you iSpindel connection to port 8086. If you don’t check the iSpindel, your DNS etc. to make sure everything is set up correctly.
InFlux configuration
This wasn’t any more difficult than following the instruction here: https://docs.influxdata.com/influxdb/v1.8/introduction/install/ for your operating system. I used Debian. The database should be up and running.
You need to create a database into which the data is put so connect via the client:
influx -precision rfc3339and enter the command
create database ispindelWith this created the data should start flowing into the database.
This is where I had the biggest problem and it was just a misunderstaning/lack of familiarity with the database.
When the iSpindel sends its data it prefixes it with a ‘table’ name. It’s not really a table, it’s an indentifier for the data to group it together… like a table. The iSpindel developers have used the name ‘measurements’ (use the -A option on tcpdump to see this ) which seems logical but the InFlux software has a built-in of ‘measurements’ and that really threw me.
In the client, if you type:
use ispindel
> show measurements
name: measurements
name
----
measurements
> show series
key
---
measurements,source=iSpindel01
measurements,source=iSpindel02
You’ll see that ‘show measurements’ shows two things both called ‘measurements’ and the ‘show series’ shows something with the key of ‘measurements’.
The above indicates that there should be a table called ‘measurements’ into which the data is being put but if you do:
select * from measurements
ERR: error parsing query: found MEASUREMENTS, expected identifier at line 1, char 15
you’ll see an error implying that the word ‘measurements’ is not a valid table.
To cut a long story short, there IS a table called ‘measurements’ and you access it by putting quotes around the name, but they have to be double quotes, not single quotes e.g.
select * from "measurements" limit 2
name: measurements
time RSSI battery gravity interval source temp_units temperature tilt
---- ---- ------- ------- -------- ------ ---------- ----------- ----
2020-12-27T13:52:51.723590086Z -70 3.931178 1.053636 60 iSpindel01 C 24.6875 55.95679
2020-12-27T13:53:51.436856179Z -72 3.941606 1.053622 60 iSpindel01 C 24.75 55.94834
So, now you can confirm that the data IS in the table. If you’re struggling then there are some logging options in the influxdb config file which might be of use.
Move onto installing Grafana
Grafana Configuration
As with InFlux, following the instructions was all that was needed really: https://grafana.com/docs/grafana/latest/installation/
Install the OSS version, unless you want to pay for the Enterprise one.
If you’re using a CNAME or a reverse proxy then you might need to change the instance_name option in the grafana.ini file to match the name in the URL being used to access the page. If you don’t then you might have issues when creating links to graphs later.
Once installed you should be able to connect to the web page and start configuring it.
The first job is the Data Source (Under Configuration->Data Sources) and to add the InFlux DB above. This should require no more than putting ‘http://localhost:8086/’ into the HTTP URL field and ‘ispindel’ into the Influx DB details->Database setting. Now ‘Save & Test’ and you should get a green success confirmation.
I found that this part was fairly straight-forward but there are couple of things to note which we’ll come to shortly.
- So, create a new dashboard.
- Add a panel to it. It’ll be a line graph by default.
- There’s no data in the graph but the query looks right? Wrong.
- In the Query section below the graph click on the words ‘select measurement’ and select the word ‘measurementS’. See the difference? It’s that problem back to haunt us.
- On the next line click on the word ‘value’. It MUST be that word, not the word ‘field’.
- Select, say, ‘temperature’ from the list.
- Now you should see data in your graph.
- You can make it into a line graph by click on the word ‘time’ in the line below and then clicking ‘Remove’.
You can figure out how to make the graph look pretty yourself.
Some tips:
If you want to have two different metrics on the same graph i.e. different left and right axes, e.g. temperature on one, gravity on the other then it’s possible but you have to assign a data set to the right axes. You do this by clicking on the coloured line in the legend on the graph itself. Not the words, the line. Then there will be a pop-up and select the y-axis tab.
If you want a gauge to, say, show the current battery level then under ‘Display’ calculation you should set it to ‘Last’.